|
1. Analysis objective
|
Sample the changes in the surface temperature and high temperature zones of an active volcano.
|
2. Analysis procedure Analysis flow chart
|
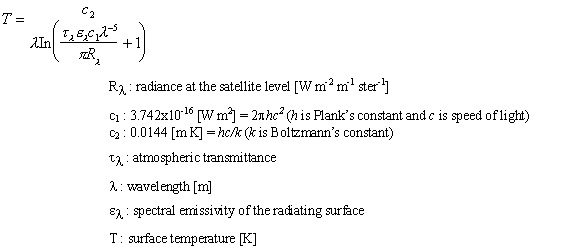
This is a technique for understanding the status of volcano activity by estimating the surface temperature distribution of a volcano from spectrum radiation brightness in the short wave infrared ray region (TM sensor bands 5 and 7) obtained from LANDSAT satellite nighttime observations, and monitoring the change over time. By assuming the atmospheric transmittance and earth's surface emissivity, the earth's surface temperature (pixel integrate temperature) can be determined from the spectral radiance by using the equation below.
We used GCP to project to map LANDSAT 5 TM data for Unzen Fugendake that was System corrected with the nearest neighbor algorithm. Because the data used here was nighttime observation data, we used the positions of high-temperature chimneys at facilities such as steelworks and cement plants for GCP. When these kinds of GCP did not exist, we used band 6 image-based GCP. Because the high temperature area of Fugendake is distributed between 800-1400m, we used 1,100m as the mean height to make the satellite parallax correction.
The parallax residual from using a mean height is about 30m. We converted the observation values into spectral radiance factors by using existing coefficients (Table 1). Next we applied Equation 1 to calculate the earth's surface temperature, by assuming these spectral radiance factors were observed at the wavelength at the center of each band.
|
3. Analysis results
|
The temperature distribution of Unzen Fugendake obtained from LANDSAT 5 TM data observed during the night of June 11, 1992 is shown in Figure 3. The scope of the image is the rectangular scope shown in Figure 2.
The areas of the high-temperature zones detected from band 5 and band 7 were approximately 0.2km2 and 0.7km2, respectively. By comparing this to the sketch of the lava dome in June 1992 (Figure 3, lower figure), when the lava dome was maximum in the 23 cloud free observations during the Unzen Fugendake 1990-1995 eruption. We can see that high-temperature zones corresponds to the high-temperature zones of the lava lobe and its surrounding areas.
Although we observed lobes 3, 6 and 7 and the red block condition lava as high-temperature regions in band 5 and band 7, we recognized a large amount of active gas in the aerial photographs taken on May 10.
On the other hand lobes 4N and 4S, where volcanic gas was not recognized from the aerial photographs from May 10, were observed as high temperature regions only in the band 7. We believe this was because the temperature of lobes 4N and 4S had decreased.
The traces of fresh pyroclastic flows were observed as long, slender high-temperature regions in band 7. It was possible to observe Mt. Unzen Fugendake during LANDSAT 5's nighttime passes 211 and 212. The visit period for LANDSAT 5 is 16 days, providing observation opportunities at a rate of once every 16 days. Observations were conducted 27 times from the start of eruptions until October 1995, and 23 cloud free images were acquired.
Thermal anomalies were observed only at bands 5-7, and no thermal anomaly was observed at other bands. Although the area of the high-temperature (120°C or greater) zone observed by band 7 was about 0.4km2 from the end of 1991 until the end of 1992, at the beginning of 1993 this decreased to 0.2km2 or less on one occasion but soon recovered to about 0.4km2 (Figure 4, upper figure).
Since the end of 1993, the size of this zone has again fallen to 0.1km2 or less. The change in the area of the high-temperature zone observed by band 7 has a high correlation with the magma discharge rate (Figure 4, lower figure) calculated from sources such as aerial photographs.
|
4. Results from using the analysis results
|
While it is possible to understand volcano activity conditions from changes in temperature distribution, the frequency of observations can be termed inadequate because of times when observations are not possible because of clouds or because of the observation frequency (once every 16 days) at the present time.
|
5. Sources
|
Nakata S., Geologic Party, Joint University Research Group: Observation Research Concerning Predictions of Changes in the Lava Dome and Unzendake Lava Flows Caused by the 1991-1992 Eruption of Mt. Unzen Fugendake Fiscal 1991 Scientific Research Expense Grant, Integrated Research (A), Reports of Research Results (Topic No. 03306009), pp. 112-123, 1992
Nakada, S. and Shimizu, H.: The 1991-1994 Activities of Unzendake Volcano. Bulletin of the Volcanological Society of Japan, Vol. 40, No. 4, pp. 2-9 (Appendix), 1995
Urai M. and Isobe I.: Surface Temperature Change of Unzen Volcano with Nighttime LANDSAT Data, Journal of the Remote Sensing Society of Japan, Vol. 15, No. 1, pp. 3-15, 1995
|
|