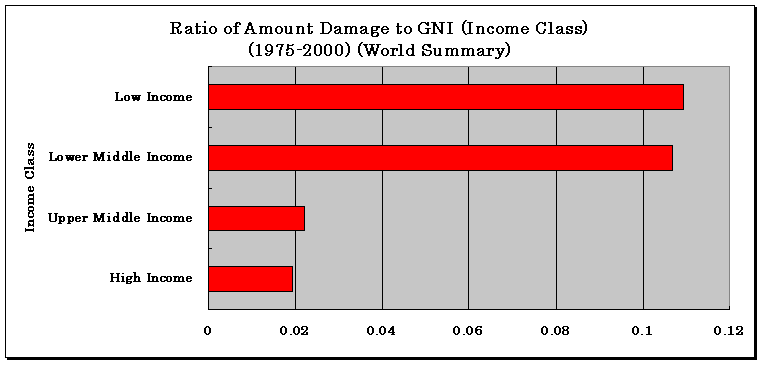
(Source: ADRC, Japan based on CRED-EM- DAT data base, 2001)
<Figure 14>

<Figure 15>
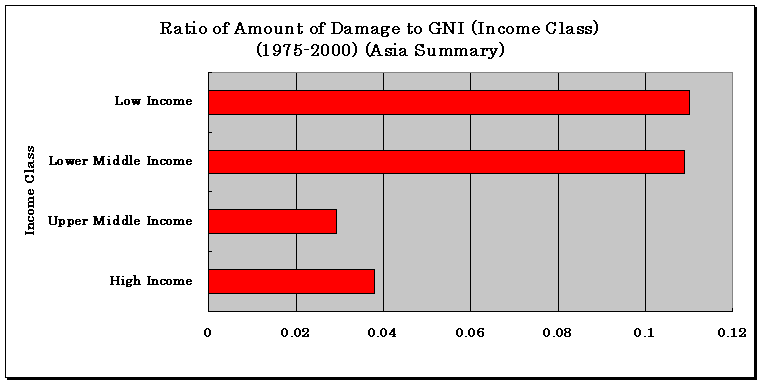
<Figure 16>
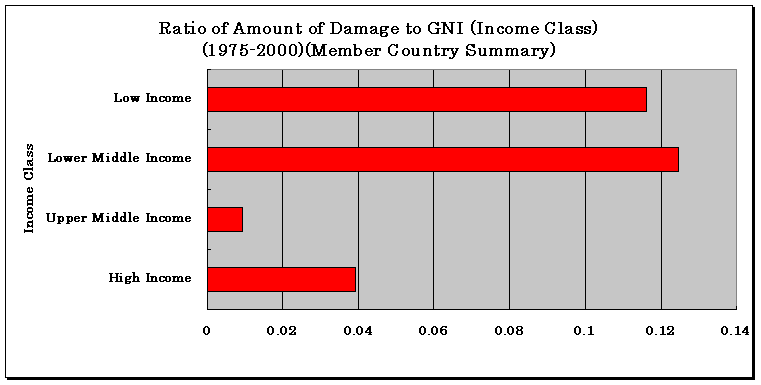
<Figure 17>
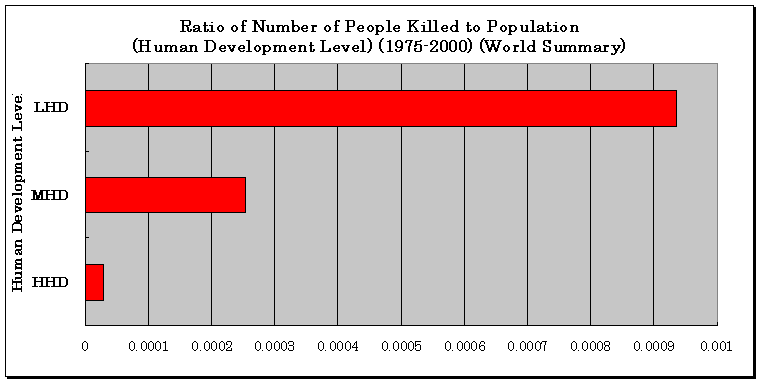
<Figure 18>
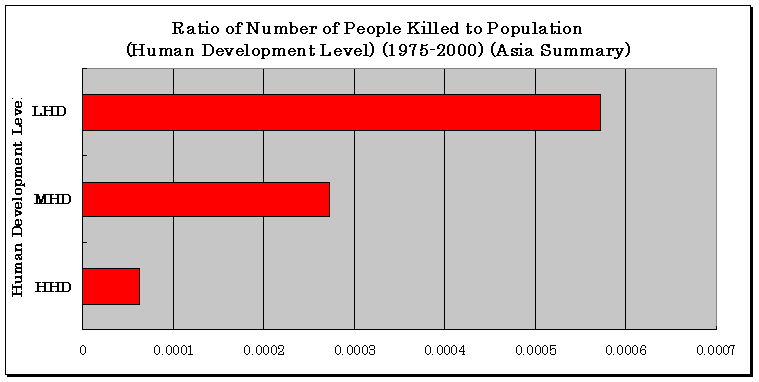
<Figure 19>
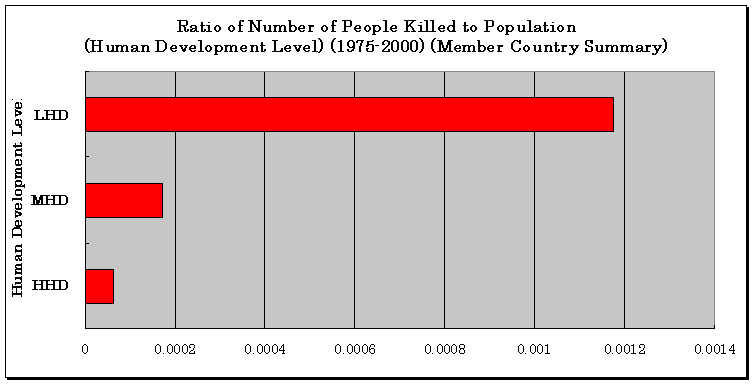
<Figure 20>
Top 10 Severest Disasters According to the
Ratio of Amount of Damage to GDP
(Member Country Summary 1975-2000)
| Rank | Country | DisType | Year | GDP (BnUS$) | Killed | Injured | Homeless | Affected | TotAff | DamageUS$ ('000s) | Dam/GDP |
| 1 | Mongolia | Forest Wild fire | 1996 | 1.18 | 25 | 61 | 5,000 | 5,061 | 1,712,800 | 1.452 | |
| 2 | Armenia(Soviet Union) | Earthquake | 1988 | 16.90 | 25,000 | 12,000 | 530,000 | 1,100,000 | 1,642,000 | 20,500,000 | 1.213 |
| 3 | Tajikistan | Flood | 1992 | 0.29 | 1,346 | 63,500 | 63,500 | 300,000 | 1.034 | ||
| 4 | Mongolia | Winter Wind storm | 2000 | 1.00 | 4 | 0 | 0 | 500,000 | 500,000 | 875,000 | 0.875 |
| 5 | Nepal | Flood | 1987 | 2.93 | 188 | 351,000 | 351,000 | 727,500 | 0.248 | ||
| 6 | Lao, P Dem Rep | Wind storm | 1993 | 1.33 | 8 | 120 | 120 | 302,151 | 0.227 | ||
| 7 | Tajikistan | Flood | 1993 | 0.68 | 5 | 60,357 | 15,000 | 75,357 | 149,000 | 0.219 | |
| 8 | Myanmar | Flood | 1991 | 2.38 | 23 | 17,570 | 359,976 | 359,976 | 498,800 | 0.210 | |
| 9 | Nepal | Earthquake | 1980 | 1.84 | 100 | 5,600 | 30,000 | 240,000 | 275,600 | 245,000 | 0.133 |
| 10 | Tajikistan | Landslide | 1992 | 0.29 | 243 | 24,100 | 0.083 |